Spatial infrastructure for
urban sustainability
Urban Maps transforms fragmented sustainability data into structured, location-based intelligence — enabling cities, developers, and investors to make informed decisions at district and building level.
Urban sustainability data exists.
Spatial intelligence does not.
Fragmented Data
Sustainability metrics exist across disconnected systems — energy consumption, emissions, building certifications, mobility patterns — with no unified view.
No Spatial Context
Data is reported at aggregate levels. Decision-makers cannot see how sustainability performance varies across districts, corridors, or individual assets.
Delayed Decisions
Without structured, location-based intelligence, planning cycles extend, compliance risks increase, and capital allocation remains reactive.
Cities are committing to net-zero targets. Developers face ESG disclosure requirements. Investors need to assess climate risk at asset level. The infrastructure to support these decisions does not yet exist at scale.
One spatial interface.
All sustainability data.
Urban Maps aggregates sustainability data from public registries, regulatory filings, sensor networks, and private sources — then normalizes and visualizes it at district and building level.

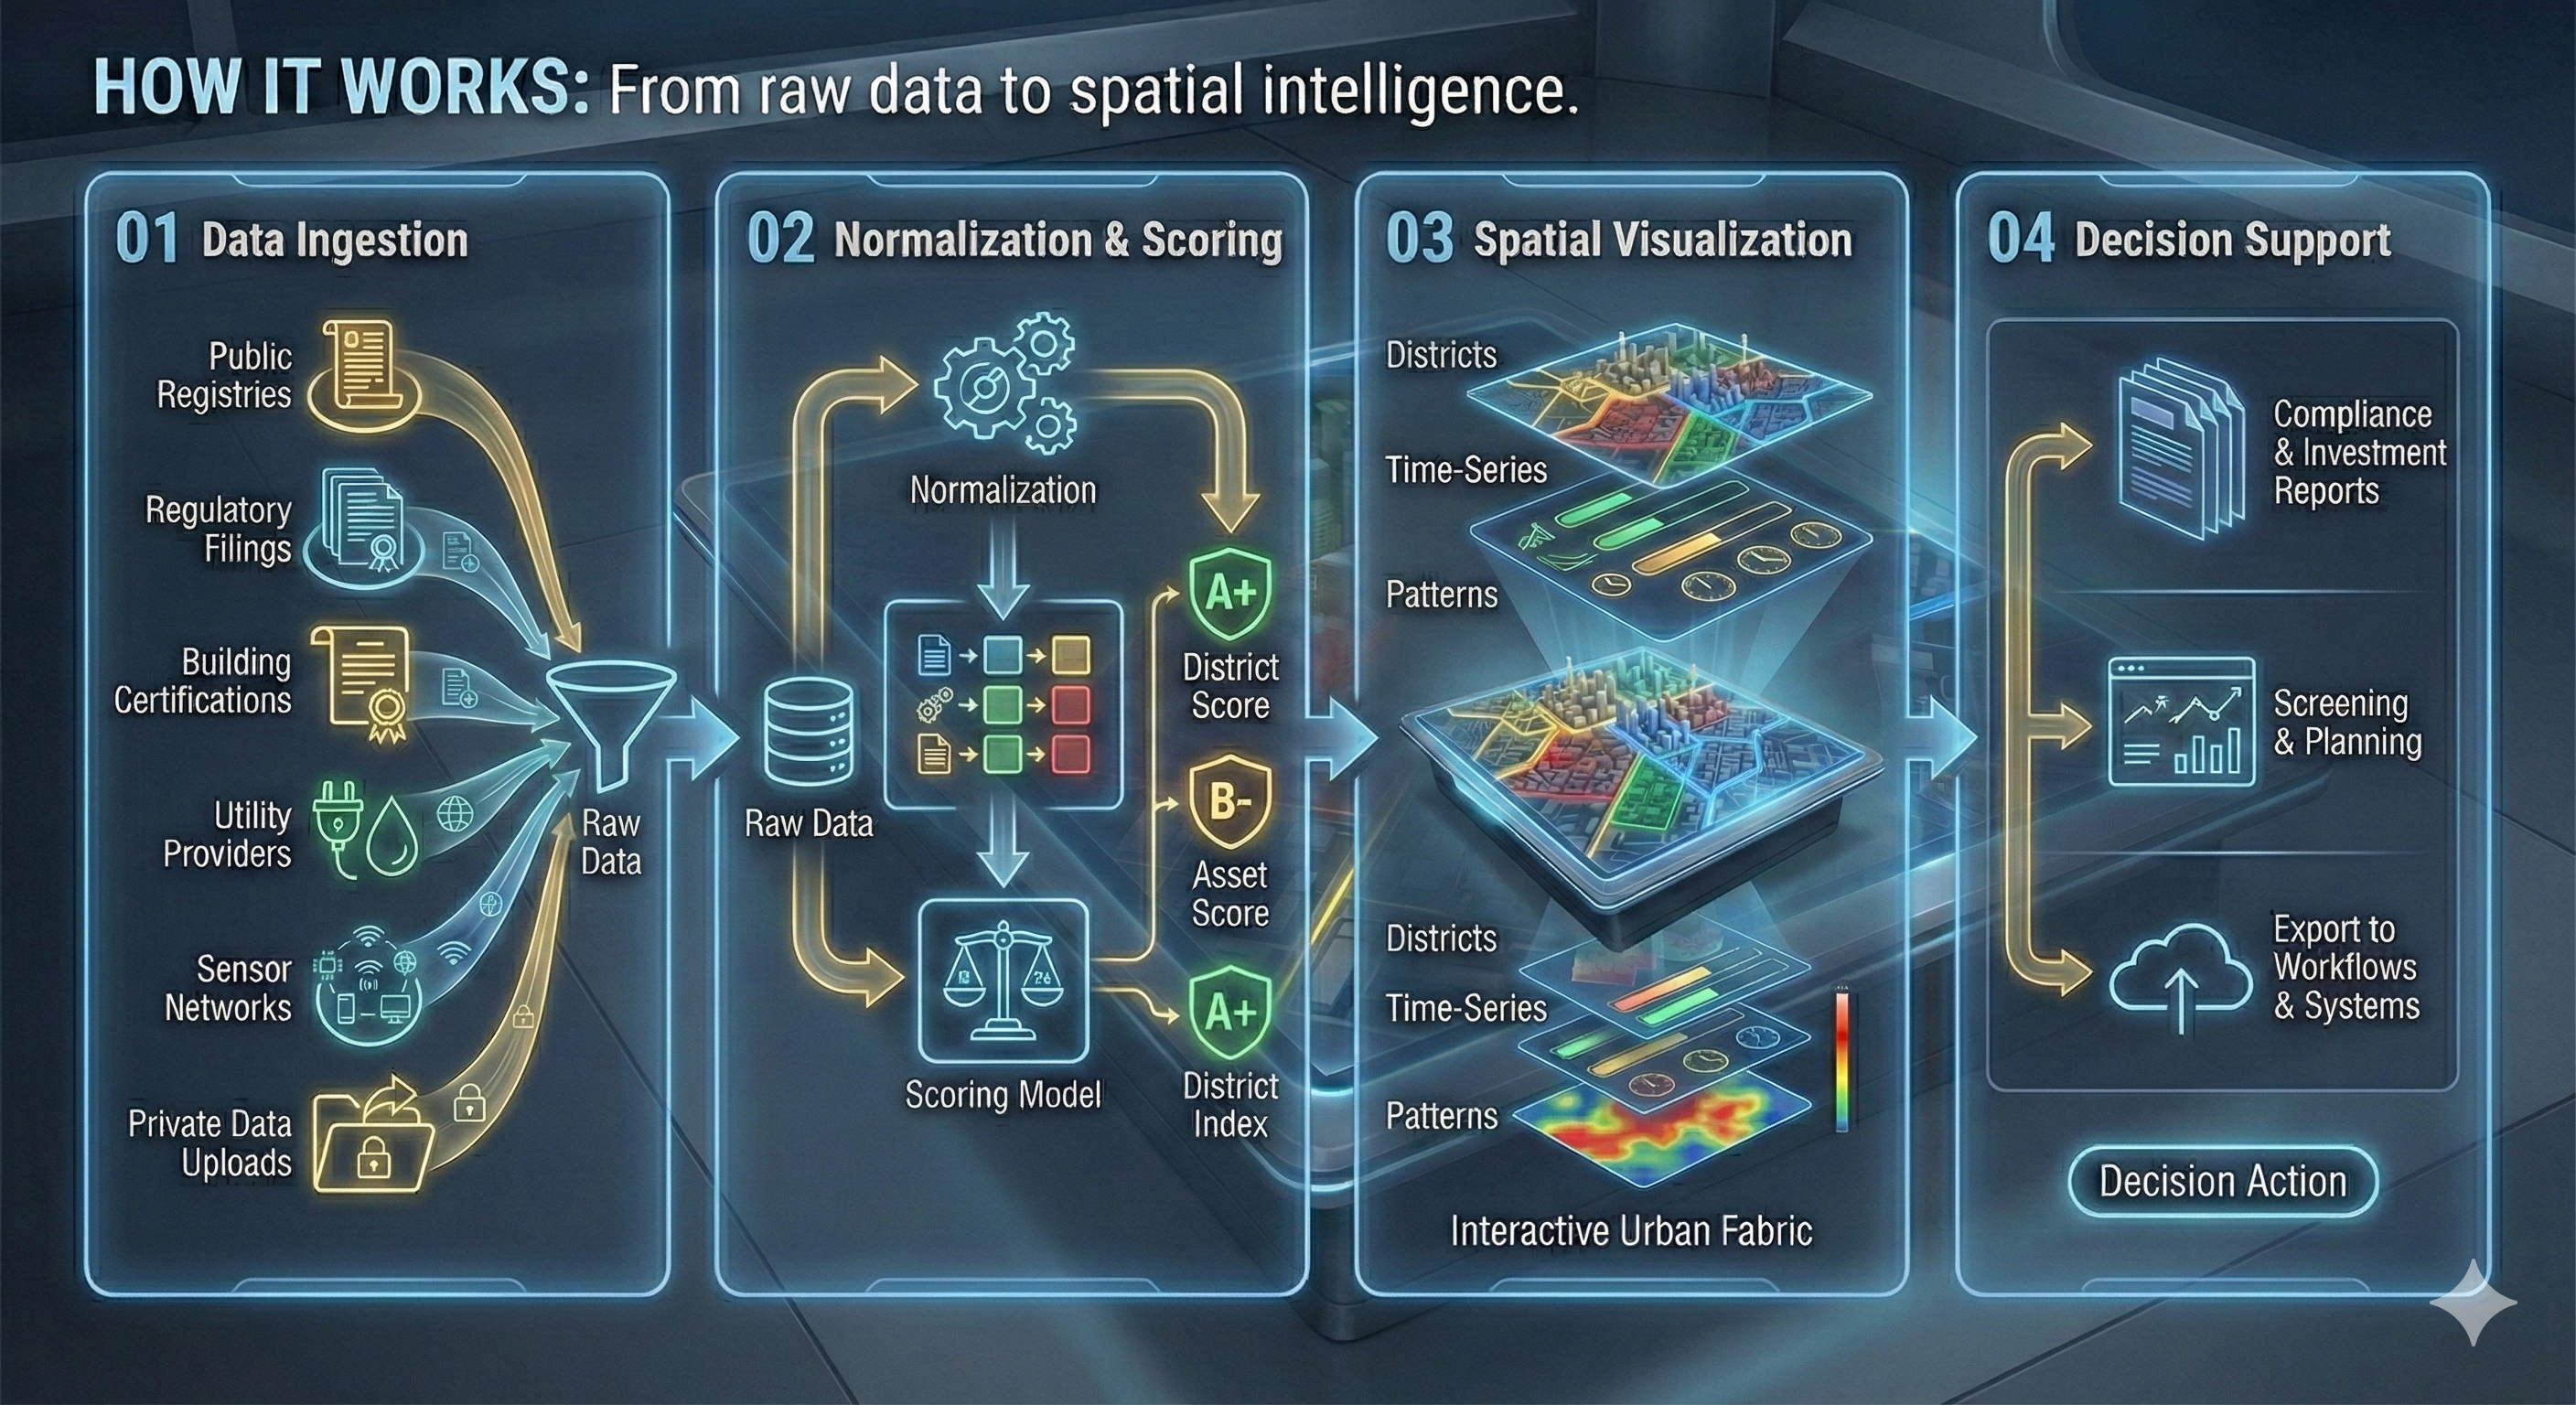
From raw data to spatial intelligence
Data Ingestion
Aggregate data from public registries, regulatory filings, building certifications, utility providers, and sensor networks. Support for private data uploads.
Normalization & Scoring
Standardize metrics across sources. Apply weighted scoring models to generate comparable sustainability indices at district and asset level.
Spatial Visualization
Render data on interactive maps with configurable layers. Compare districts, track changes over time, and identify patterns across the urban fabric.
Decision Support
Generate reports for compliance, investment screening, and planning. Export data for integration with existing workflows and systems.
Built for institutions that shape cities
City Governments & Municipalities
Monitor sustainability performance across districts. Track progress toward net-zero commitments. Identify underperforming areas for targeted intervention.
- District-level sustainability dashboards
- Progress tracking against climate targets
- Evidence-based policy development
Real Estate Developers
Assess sustainability context before acquisition. Benchmark projects against district averages. Generate compliance documentation for ESG reporting.
- Site selection and due diligence
- Project benchmarking
- ESG disclosure support
Institutional Investors
Screen assets by sustainability criteria. Assess climate risk at portfolio level. Support TCFD and EU Taxonomy alignment reporting.
- Portfolio sustainability screening
- Climate risk assessment
- Regulatory compliance reporting
Urban Planners & Consultants
Access structured data for master planning. Compare scenarios across districts. Support clients with evidence-based recommendations.
- Master plan development
- Scenario comparison
- Client advisory support
Predictable revenue from institutional contracts
Annual SaaS Licenses
Tiered annual subscriptions for cities, developers, and investors. Pricing based on geographic coverage, user seats, and data refresh frequency.
Premium Analytics
Add-on modules for advanced analytics, custom benchmarking, and proprietary data layers. Sold as annual upgrades to base licenses.
Revenue model designed for institutional budget cycles. Multi-year contracts with annual renewals. Net revenue retention expected above 110% through upsells and geographic expansion.
Conservative three-year projection
Based on institutional sales cycles, regional market size, and comparable B2G/B2B SaaS benchmarks in the urban technology sector.
Why Dubai and MENA
The region offers a unique combination of market conditions that favor early-stage urban technology platforms.
Rapid Urban Development
Dubai and the broader GCC region are among the fastest-growing urban environments globally. New districts, mega-projects, and infrastructure investments create immediate demand for sustainability intelligence.
Regulatory Momentum
UAE Net Zero 2050 strategy, Dubai Clean Energy Strategy 2050, and emerging ESG disclosure requirements are creating compliance pressure across public and private sectors.
Centralized Decision-Making
Government-led development and concentrated ownership structures enable faster procurement cycles and larger contract values compared to fragmented Western markets.
Smart City Infrastructure
Existing investments in digital infrastructure, open data initiatives, and smart city platforms provide a foundation for data aggregation and integration.
Infrastructure for urban sustainability
Urban Maps is designed as extensible infrastructure — not a point solution. The platform architecture supports multiple expansion vectors.
Geographic Expansion
Replicate the data model across cities and regions. Each new market adds recurring revenue while leveraging existing infrastructure.
Data Layer Expansion
Integrate additional datasets: mobility, air quality, water, waste, social infrastructure. Each layer increases platform value and pricing power.
Service Integration
Enable third-party services: carbon offset marketplaces, green financing, certification workflows. Platform becomes infrastructure for urban sustainability transactions.
"The long-term opportunity is to become the spatial data layer for urban sustainability — the infrastructure that cities, investors, and developers rely on to understand and improve the built environment."
Start a conversation
Whether you're an investor, developer, or city planner — we'd love to explore how Urban Maps can support your sustainability goals.